# Using Linux to Monitor Room Temperature Remotely and Cheaply
I recently decided that I was going to monitor and graph the temperature in my
living room. I wanted to do this purely for curiosity, so didn't want to spend
much money on a solution. The HTPC in my
living room runs [Ubuntu](https://www.ubuntu.com/), so I looked for a USB
thermometer which is supported under Linux and came across the TEMPer Winter USB
Thermometer on Amazon. For only £15.49 (including delivery). I decided it was
worth a try.
It took a few weeks to deliver because it came from Hong Kong, but once it
arrived it didn't take long to set up. There were no instructions or drivers. I
simply plugged it into my HTPCs USB port and ran the following
[Perl](https://www.perl.org/) script (as root):
```perl
#!/usr/bin/perl
use strict;
use warnings;
use Device::USB::PCSensor::HidTEMPer;
my $pcsensor = Device::USB::PCSensor::HidTEMPer->new();
my @devices = $pcsensor->list_devices();
foreach my $device ( @devices ){
print $device->internal()->celsius()."C\n" if defined $device->internal();
}
```
I saved the script as "temperature.pl" and now all I have to do is SSH into my HTPC and do this:
```console
root@gum:~# temperature.pl
17.5C
root@gum:~#
```
Of course, I had to install the Device::USB::PCSensor::HidTEMPer Perl module
first using the cpan command. I also wanted to graph the temperature in my flat
over time, so I wrote another Perl script which uses
[RRD](https://www.mrtg.org/rrdtool/) to collect the data and generate hourly,
daily, weekly, monthly and yearly graphs. You can take a look at the script
[here](/projects/temperature_grapher.txt).
Below is an example weekly graph generated by my script. 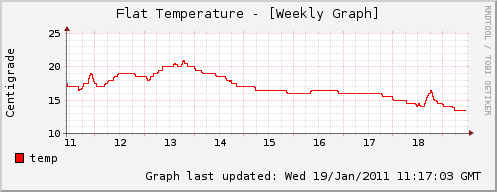 The spikes that you see correspond to when I
turned my heater on. I also have a [Z-Wave](https://www.z-wave.com/) setup which
allows me to remotely turn my heater on/off, but I will talk about that another
day.